By IndexBox
•
July 8, 2026
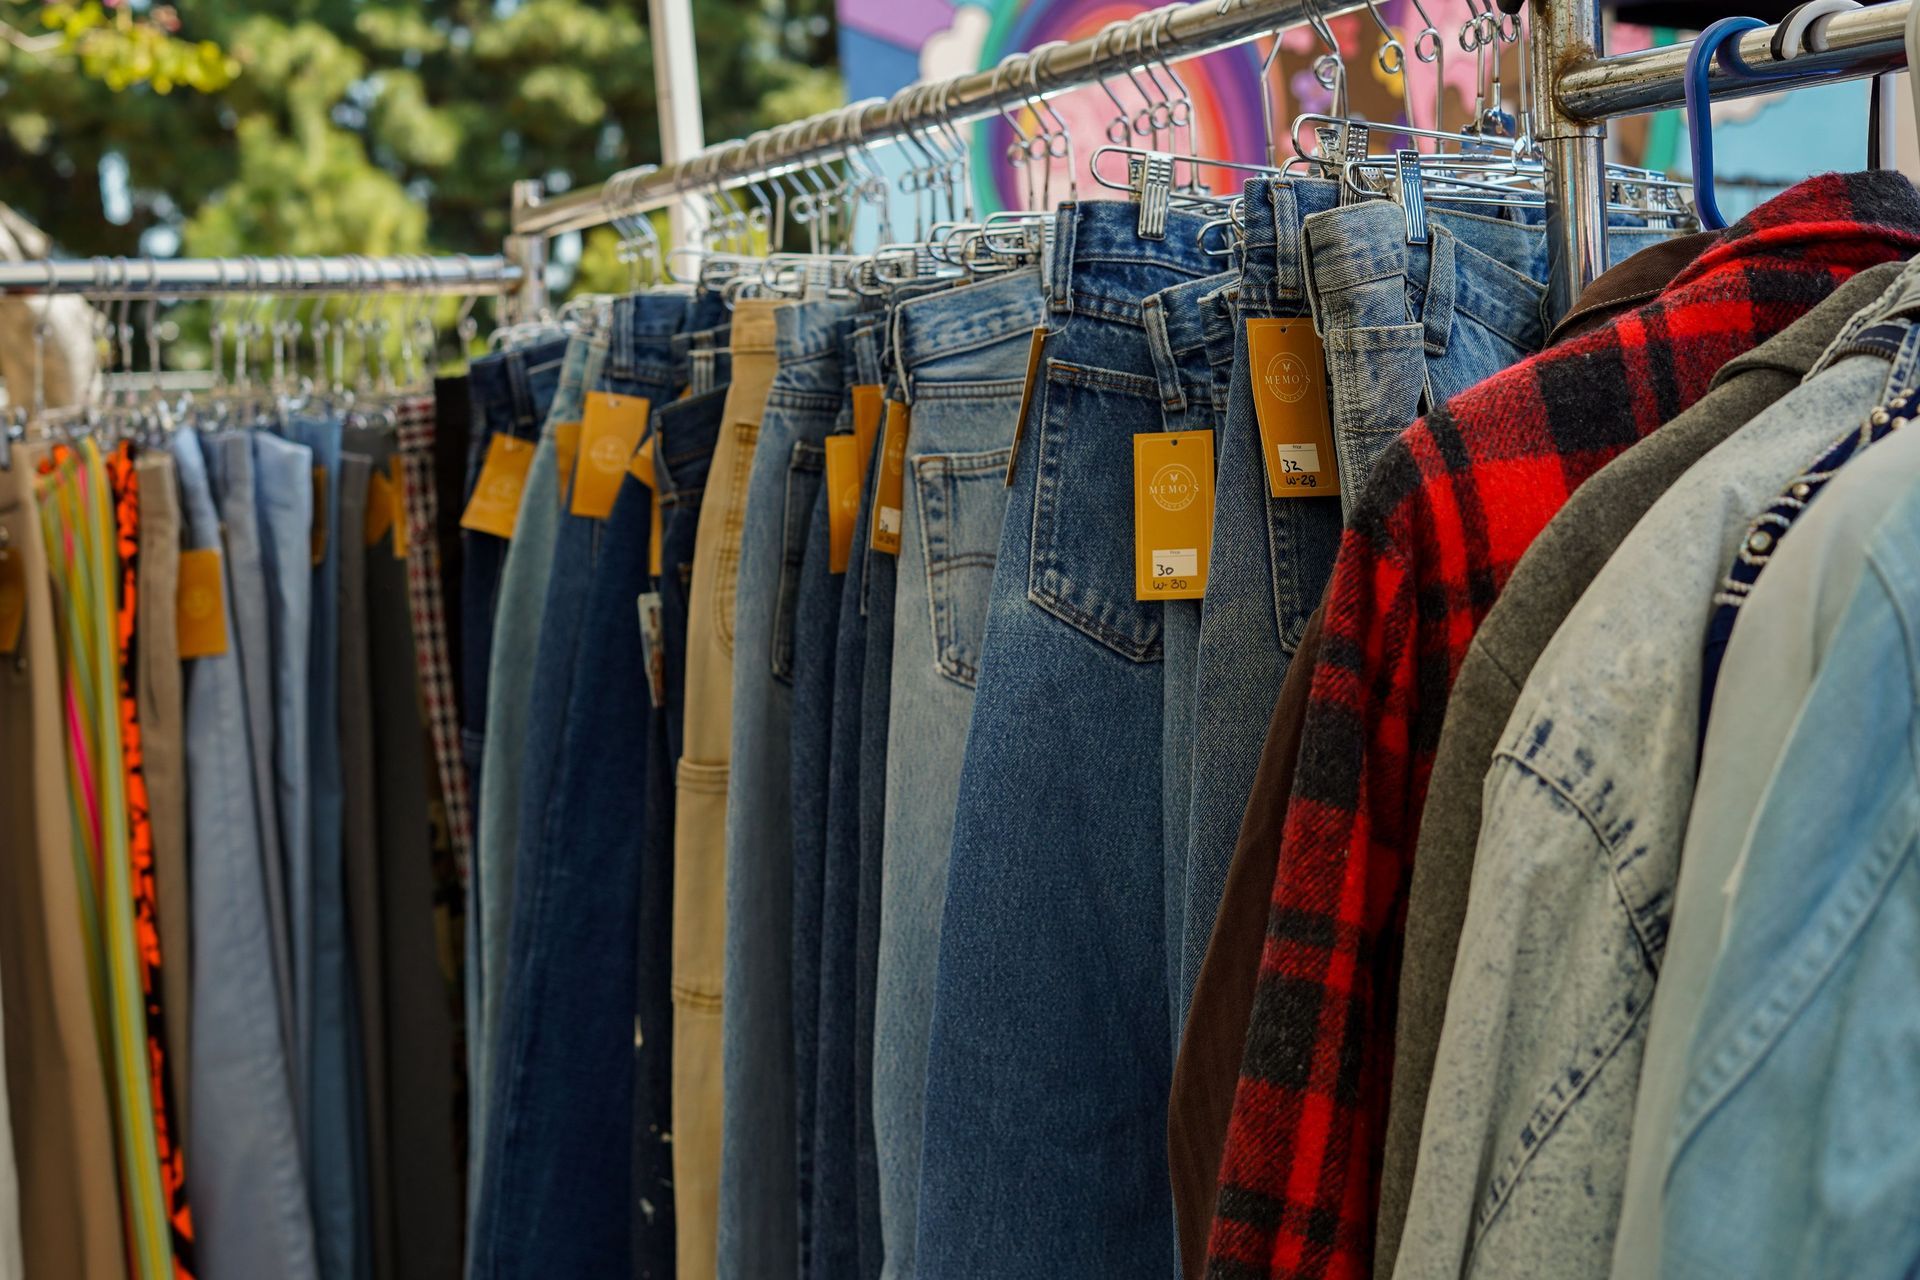
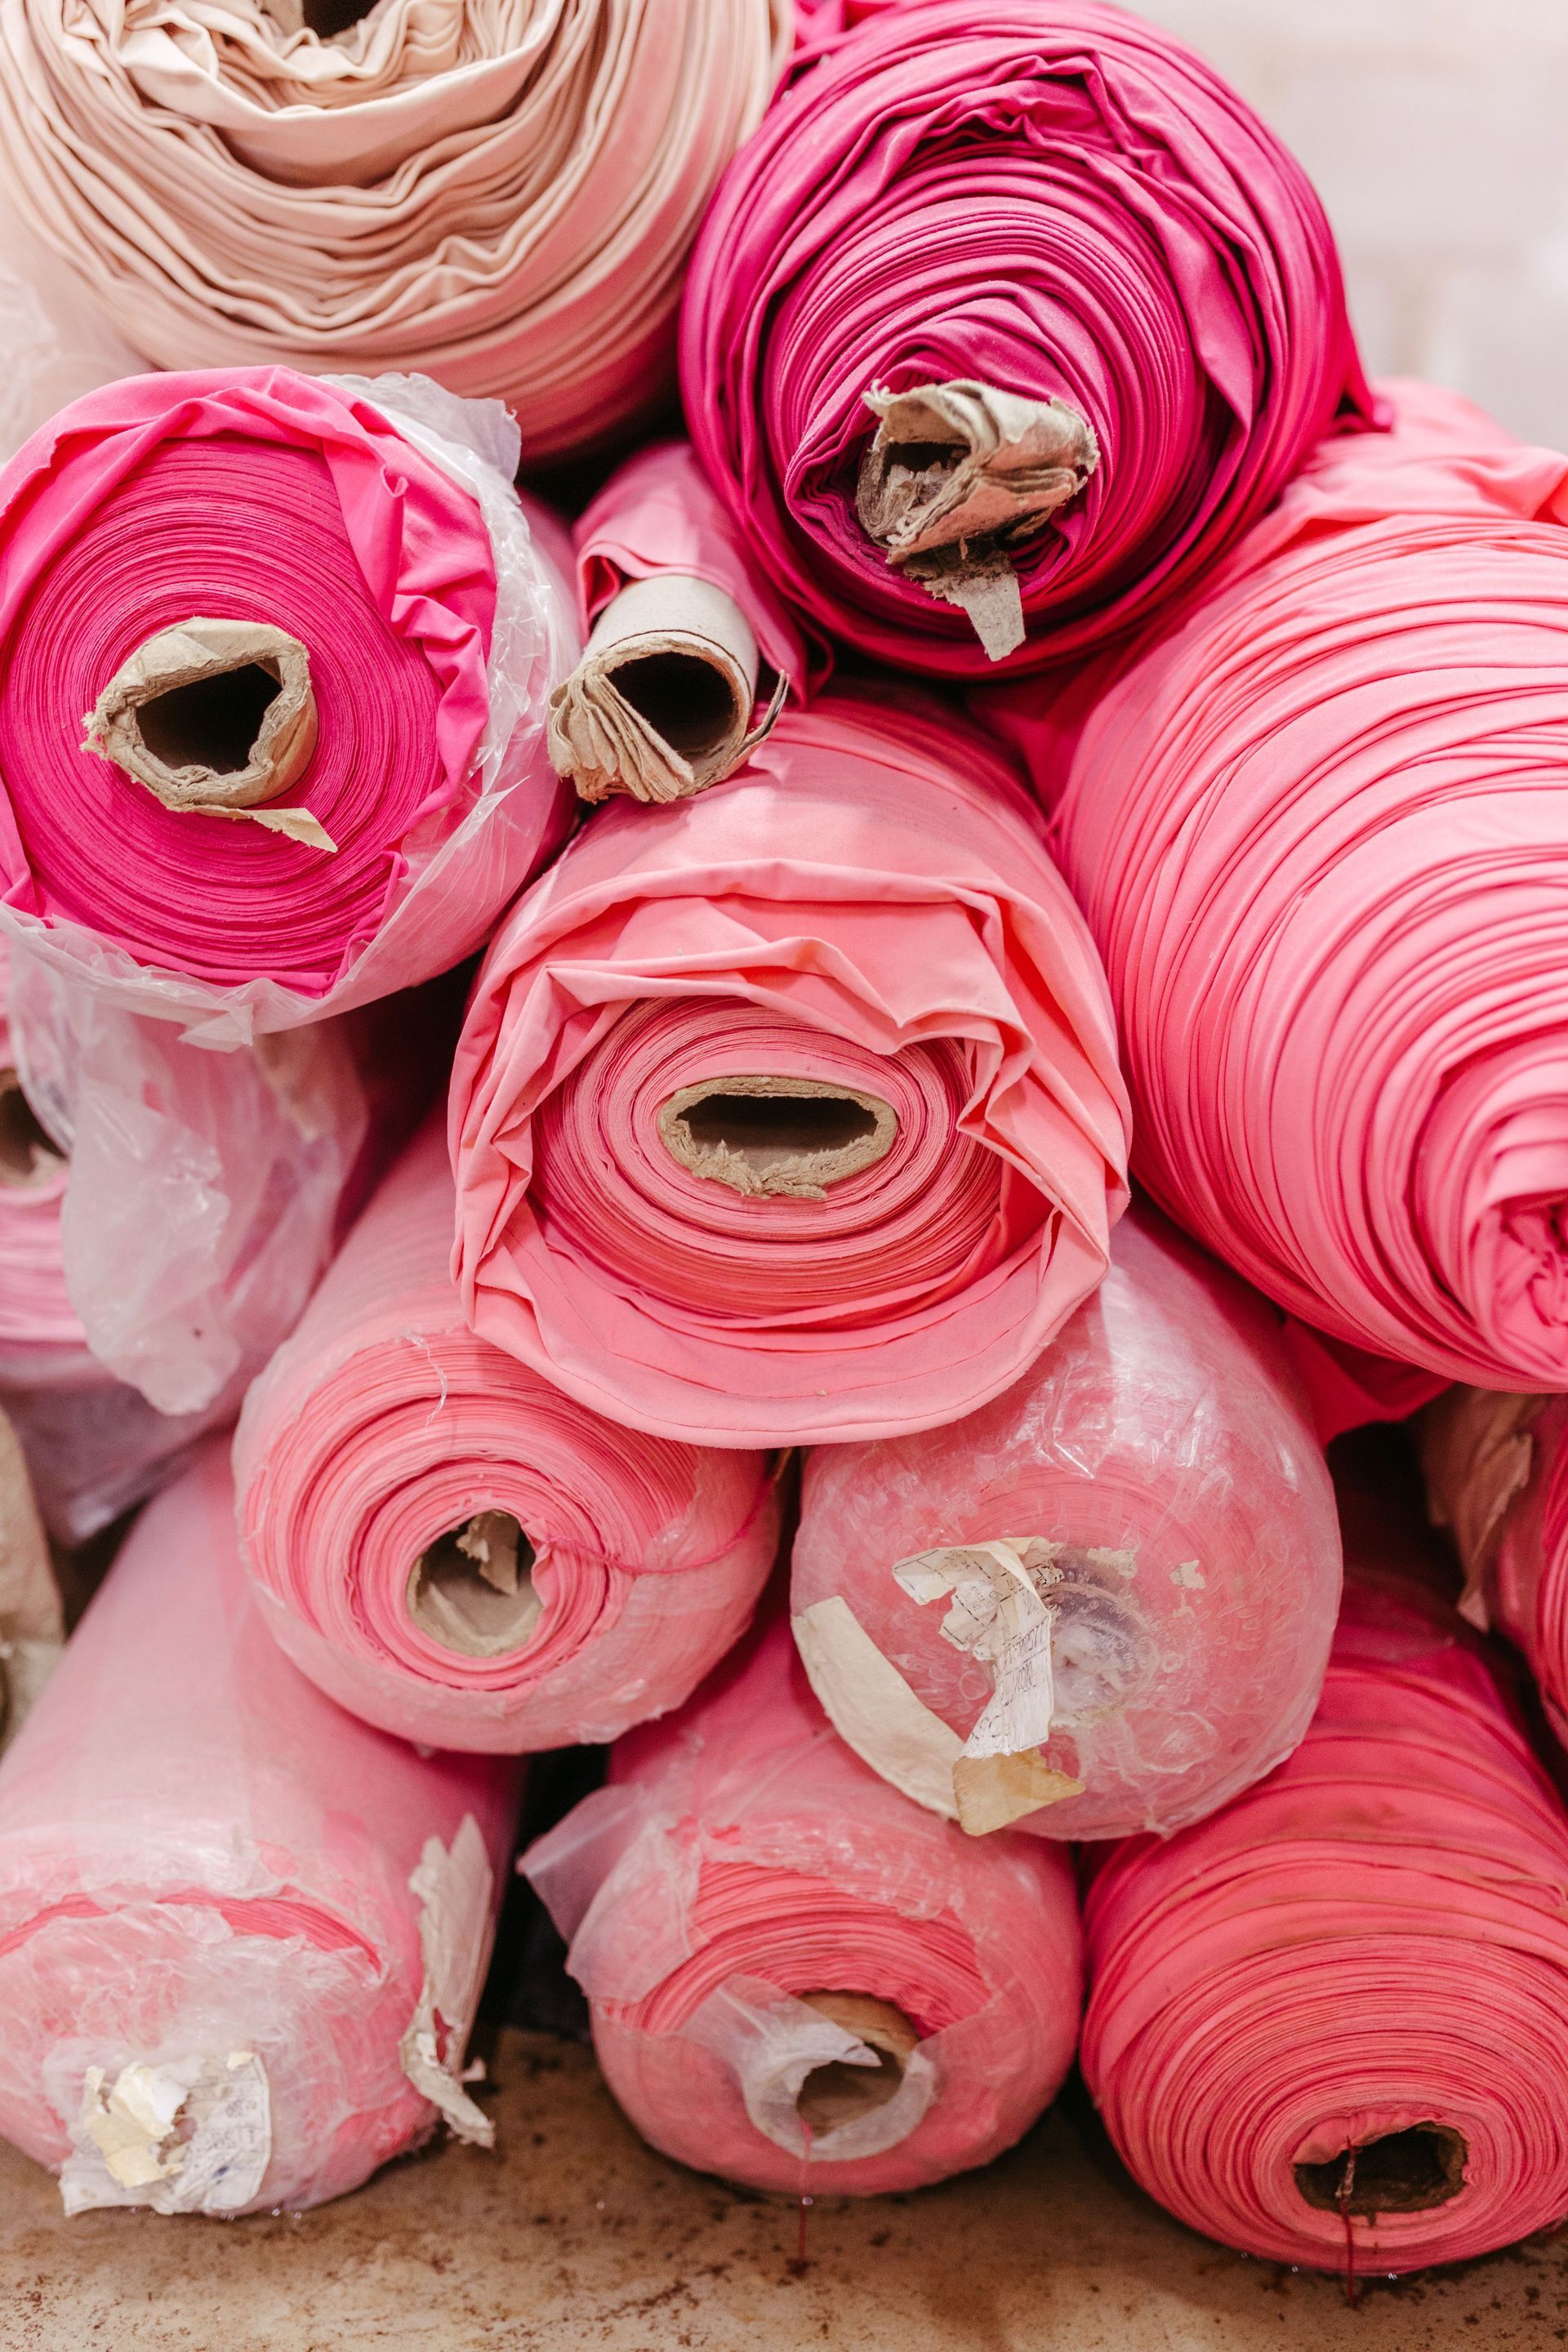
Thrift stores act as a frontline barrier against textile waste, and shifting consumer perspectives on thrifting and resale could help refine recycling systems and pull more material away from landfills in the years ahead, according to panelists at a Northeast Recycling Council material reuse forum webinar held on Tuesday. Executives from thrift stores and researchers from the National Institute for Standards and Technology pointed out that secondhand clothing holds a strong position in U.S. textile export markets, which in turn shapes how and when textiles reach recycling streams. A rising enthusiasm for thrifting, upcycling, and clothing repair could extend the useful life of garments, and when textiles become too worn for wear, emerging sorting technologies could more efficiently handle end-of-life textiles to improve end markets, they noted. Thrift Stores: Making Landfill Diversion Attractive Thrifting is not a novel idea, but Americans have grown increasingly open to it in recent years due to a mix of rising costs, tariff worries, and economic instability, along with lingering effects of the COVID-19 pandemic, when people had extra time to sort through their closets for items to donate, said Giana Manganaro Cronin, associate director of retail for More Than Words, a nonprofit youth job training program based in the Boston area. More Than Words leverages its thrift stores as a primary means to deliver job training and secure stable employment for participating youth, she explained. The organization previously sold used books, but a surge in interest in secondhand shopping triggered by the pandemic led the nonprofit to adopt a thrift store model instead. This shift was not only vital for the environment and for keeping more items out of landfills, but also beneficial for the business and the young people involved, she said. The nonprofit's thrift stores, known as Boomerangs, achieve a 98% margin compared to the previous 62% margin from its retail bookstore model, and Manganaro Cronin anticipates this trend will persist. Gen Z shoppers are driving this movement, partly because minimizing their environmental impact is a fundamental value for that group, she noted. About 64% of shoppers in that age bracket explore resale options before purchasing new items, she added. Young consumers are expected to keep shaping this trend, said Uli Stosch, chief officer of strategic development for Planet Aid, a thrift store nonprofit that has gathered and reused over 2 billion pounds of clothing since its founding in 1997. Drawing on data from an annual resale report by online thrift company ThredUp, she noted that the U.S. secondhand apparel market expanded by 14% in 2024 and is projected to hit $74 billion by 2029. Labor-Intensive Export and Recycling Markets More Than Words and similar thrift stores strive to sell as many items as possible, but for unsellable goods, the organization frequently collaborates with secondary buyers such as wholesalers who have access to a wide array of additional secondhand markets, Manganaro Cronin said. Stosch noted that thrift stores and other secondhand retailers typically sell between 10% and 50% of their inventory, with a minor portion ending up in the trash, mainly soiled items unsuitable for wearing or use. Another share is categorized as mixed rags and baled for export, where it undergoes further sorting for reuse, resale, or recycling. Many of these bales are sent to Pakistan and Malaysia, where workers are trained to manually sort each piece to separate quality clothing for resale while diverting lower-quality textiles for other uses. Stosch described this process as extremely labor-intensive, requiring long hours of standing and sorting through items, and noted that there is a cap on how much textiles can be handled this way due to the time involved. From there, many clothes intended for resale are shipped to countries in Africa, the Caribbean, and Central America. Over 1.5 billion people globally depend on secondhand clothing, she said, particularly as an alternative to low-quality fast fashion brands. Guatemala has a notably strong secondhand import market, she added. A 2025 study by Full Cycle Resource found that the country imported 290 million pounds of clothing in 2023 and reused more than 91% of it, with women-owned clothing stores accounting for over half of the industry. Complex Streams, Complex Recycling Options When clothing or textiles are too worn or unfit for further wear and have already been downgraded to rags or industrial cloth, recycling becomes one of the next best options. This is where a fresh set of difficulties emerges, said Katarina Goodge, a materials research engineer at NIST. Textiles represent a complex and challenging waste stream to sort, partly because no established standards exist for handling these materials today, she said. Establishing standards would help boost efficiency in this system, she added. Another issue is that textile sorting is predominantly done manually, unlike other recycled materials that can be quickly sorted using various AI-enabled robotic sorting technologies, Goodge noted. One reason manual sorting remains standard is the difficulty in determining a garment's exact composition. Goodge explained that knowing the fiber content is essential to know how to recycle a garment, but the tag inside might only state it is made of 95% rayon and 5% other, or an itchy tag might be completely removed. She emphasized the need for a more systematic and technological approach, and noted that technology is advancing. Handheld near-infrared devices can reveal a garment's material composition, and when combined with AI or machine learning models, identifying fiber contents can become faster and more efficient. A handheld NIR scanner could be used alongside manual sorting to direct garments into appropriate bins, Goodge said, and larger-scale systems might identify textiles while on a conveyor belt, with a robotic arm component to pick out specific items. In the U.S., textile recycling infrastructure is less common than curbside recycling systems, though some companies have invested in such technology in recent years. A Future of Reuse, Repair, and Policy Change Legislation could drive changes in textile recycling efforts in the years ahead, the speakers said. California's extended producer responsibility for textiles law is being implemented, which will encourage more outlets for clothing donation, repair, and recycling, Stosch said. Countries in the EU are also required to implement similar textile EPR programs. Meanwhile, disposal bans in states like Massachusetts have led both thrift stores and lawmakers to consider what to do with textiles that are not suitable for resale but could be recycled into other products, Stosch said. Most thrift stores will accept apparel that is torn or missing buttons, as long as it is clean, she noted, adding that if it is clean, it can be turned into something else. There is also potential for creative ways to reuse or repair clothing before it reaches a recycling center, speakers added. For instance, community repair events are effective for teaching basic sewing skills and inspiring people to create something new from old apparel, Goodge said. She noted that the U.S. once had some infrastructure for repair, but that has largely disappeared because it is difficult to keep economically viable, yet repair efforts have significant potential to keep many garments as garments. P Read on IndexBox.