The Plastic Waste Crisis Is An Opportunity For The U.S. To Get Serious About Recycling At Home
December 4, 2018
Today’s Guest Blog is by Kate O'Neill. It was originally posted in The Conversation on August 17, 2018.
Today’s unprecedented level of public concern is an opportunity to innovate
A global plastic waste crisis is building, with major implications for health and the environment. Under its so-called “National Sword” policy, China has sharply reduced imports of foreign scrap materials. As a result, piles of plastic waste are building up in ports and recycling facilities across the United States.
In response, support is growing nationally and worldwide for banning or restricting single-use consumer plastics, such as straws and grocery bags. These efforts are also spurred by chilling findings about how micro-plastics travel through oceans and waterways and up the food chain.
I have studied global trade in hazardous wastes for many years and am currently completing a book on the global politics of waste. In my view, today’s unprecedented level of public concern is an opportunity to innovate. There is growing interest in improving plastic recycling in the United States. This means getting consumers to clean and sort recyclables, investing in better technologies for sorting and reusing waste plastics, and creating incentives for producers to buy and use recycled plastic.
Critiques of recycling are not new, and critiques of recycling plastic are many, but I still believe it makes sense to expand, not abandon, the system. This will require large-scale investment and, in the long term, implementing upstream policies, including product bans.
Plastic litter on California beaches has decreased since the state banned single-use plastic bags in 2016.
Easy to use, hard to destroy
Plastics make products lighter, cheaper, easier to assemble and more disposable. They also generate waste, both at the start of their life cycles – the petrochemicals industry is a major source of pollution and greenhouse gas emissions – and after disposal.
The biggest domestic use by far for plastic resin is packaging (34 percent in 2017), followed by consumer and institutional goods (20 percent) and construction (17 percent). Many products’ useful lives can be measured in minutes. Others, especially engineered and industrial plastics, have a longer life – up to 35 years for building and construction products.
After disposal, plastic products take anywhere from five to 600 years to break down. Many degrade into micro-plastic fragments that effectively last forever. Rather like J.R.R. Tolkien’s One Ring, plastics can be permanently destroyed only through incineration at extremely high temperatures.
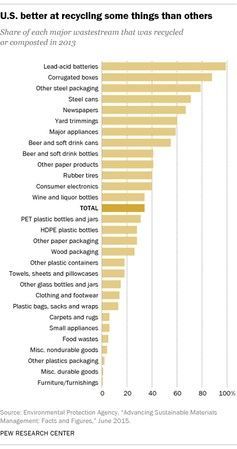
Why the United States recycles so little plastic
Less than 10 percent of discarded plastics entered the recycling stream in the United States in 2015, compared with 39.1 percent in the European Union and 22 percent in China. Another 15 percent of U.S. plastic waste is burned in waste-to-energy facilities. The remaining 75 percent goes to landfills. These figures do not include any dumping or illegal disposal.
Even the most easily recyclable plastics have a lengthy journey from the recycling bin to their final destinations. Many barriers have become painfully apparent since China, which until recently accepted half of all U.S. plastic scrap, implemented its crackdown on March 1, 2018.
First, there are many different types of plastics. Of the seven resin identification codes stamped on the bottom of plastic containers, only 1’s and 2’s are easily recyclable. Public education campaigns have lagged, particularly with respect to cleaning and preparing plastics for recycling. Getting consumers to commit to more stringent systems is critical. But scolding can backfire, as experience with food waste shows.
Another factor is U.S. reliance on single-stream recycling systems, in which all recyclables are placed in the same receptacle. This approach is easier for consumers but produces a mixed stream of materials that is difficult and expensive to sort and clean at recycling facilities.
The United States currently has 633 materials recycling facilities, which can clean, sort and bale a total of 100,000 tons of recyclables per day. Today they are under growing pressure as scrap piles up. Even before China’s restrictions went into effect, materials recycling facilities operators threw out around half of what they received because of contamination. Most are not equipped to meet China’s stringent new contamination standards, and their processing rates have slowed – but garbage production rates have not.
Finally, since China was the U.S. plastic scrap market’s main buyer, its ban has eliminated a key revenue stream for municipal governments. As a result, some waste collection agencies are suspending curbside pickup, while others are raising prices. All 50 states have been affected to some extent.

No silver bullets
Numerous public and private entities are working to find a more viable solution for plastics recycling. They include plastics producers and recyclers, corporations such as Coca-Cola, colleges and universities, foundations, international organizations, advocacy groups and state governments.
Upgrading materials recycling facilities and expanding domestic markets for plastic scrap is an obvious priority but will require large-scale investments. Increasing waste-to-energy incineration is another option. Sweden relies on this approach to maintain its zero waste model.
But incineration is deeply controversial in the United States, where it has declined since 2001, partly due to strong opposition from host communities. Zero-waste and anti-incineration advocates have heavily criticized initiatives such as the Hefty EnergyBag Program, a recent pilot initiative in Omaha, Nebraska to divert plastics to energy production. But small companies like Salt Lake City-based Renewlogy are working to develop newer, cleaner ways to convert plastics to energy.
Efforts to cut plastic use in the United States and other wealthy countries are focusing on single-use products. Initiatives such as plastic straw and bag bans build awareness, but may not significantly reduce the problem of plastic trash by themselves. For example, plastic straws account for only 0.03 percent of the plastic that is likely to enter the oceans in any given year.
Industry is starting to push back, with corporations like McDonald’s resisting straw bans. Some U.S. states have passed measures forbidding plastic bag restrictions.
To stem ocean plastic pollution, better waste management on land is critical, including steps to combat illegal dumping and manage hard-to-recycle plastics. Examples include preventing BPA leaching from discarded products, dechlorinating polyvinyl chloride products, on-site recycling of 3D printer waste, and making virgin-quality plastic out of used polypropylene.
The European Union is developing a circular economy platform that contains a multi-part strategy to increase plastics recycling and control waste. It includes making all plastic packaging recyclable by 2030 and reducing leakage of plastic products into the environment. The United States is unlikely to adopt such sweeping policies at the national level. But for cities and states, especially those where support for environmental protection is strong, it could be a more attainable vision.
Video: California Plastic Bag Ban Impact Felt On Beaches
~~~~
Kate O’Neill is Associate Professor, Global Environmental Politics, University of California, Berkeley. The Conversation US arose out of deep-seated concerns for the fading quality of our public discourse – and recognition of the vital role that academic experts can play in the public arena. Independent and not-for-profit, it is part of a global network of newsrooms first launched in Australia in 2011. Republished under a creative commons license from The Conversation.com.
NERC welcomes Guest Blog submissions. To inquire about submitting articles contact Megan Schulz-Fontes. Disclaimer: Guest blogs represent the opinion of the writers and may not reflect the policy or position of the Northeast Recycling Council, Inc.
Share Post