Plastic World

November 7, 2017

November 7, 2017


Plastics are ubiquitous; this fact cannot be denied. Many plastics are needed to support our happy modern day lifestyles. But where do we draw the line on our ever-growing production of plastics; and even more importantly, the ever-increasing environmental impacts of plastic materials?


According to the nonprofit Plastic Oceans, the world produces almost 300 million tons of plastic each year. Adding to the environmental burden, fully one-half of the plastics produced are for single use.


For years, the growing Chinese economy provided a reliable market for recycled plastics and other materials. However, in large part because of changes in domestic recycling practices, U.S. exports to China (and other countries) of “recyclable material” increasingly contained dirty and poorly sorted materials, or even materials contaminated with hazardous substances such as lead or mercury. In 2013, China went on the offensive to clean up these imports with its “Operation Green Fence.”


This past July, China notified the World Trade Organization (WTO) of its intention to ban 24 types of solid waste imports, most notably plastics, paper, and textiles. Considering that $5.6 billion in scrap commodities were exported from the United States to China in 2016, one can imagine how the impact on the recycling industry could seem unsurmountable. Just last year, almost a quarter of our country’s largest exporters (by volume) were recyclers of paper, plastic, or metal.


Municipalities and processors are now scrambling to find markets for collected plastics. Many are finding that they will receive no revenue; indeed, they may even have to pay to get rid of materials. Communities are scaling their collection back to accepting only #1 PET or #2 HDPE bottles and containers. Markets for plastic bags and other film plastic, as well as rigid plastics like plastic lids, bins, or crates, and mixed plastics (a category that includes plastic cups and a range of food containers) are particularly constrained.


North America has processing capacity for clean, sorted streams of PET and HDPE bottles, and even polypropylene resins. For films and non-bottle rigids, China’s ban presents more of an issue. End markets for these materials have depended on exports as there isn’t enough domestic processing capacity. The limitation of North American processing capacity is, however, only one facet of the plastic issue.


Exporting our plastics to China allowed us to put a false happy face…a “plastic facade”, if you will, on our overuse of this valuable resource. While our industry voices its opposition to China’s ban, we are all nonetheless culpable for the current situation. We are all responsible for polluted communities in China and other countries that have imported the packaging and remnants of our consumer culture.


I recently viewed “Plastic China,” a movingly poignant film that puts a real face on the people processing so much of our plastic scrap. When the film was made in 2016, China was the world’s biggest plastic waste importer, receiving ten million tons of recycled material per year. Much of this material was processed at small, “plastic waste household-recycling workshops.”


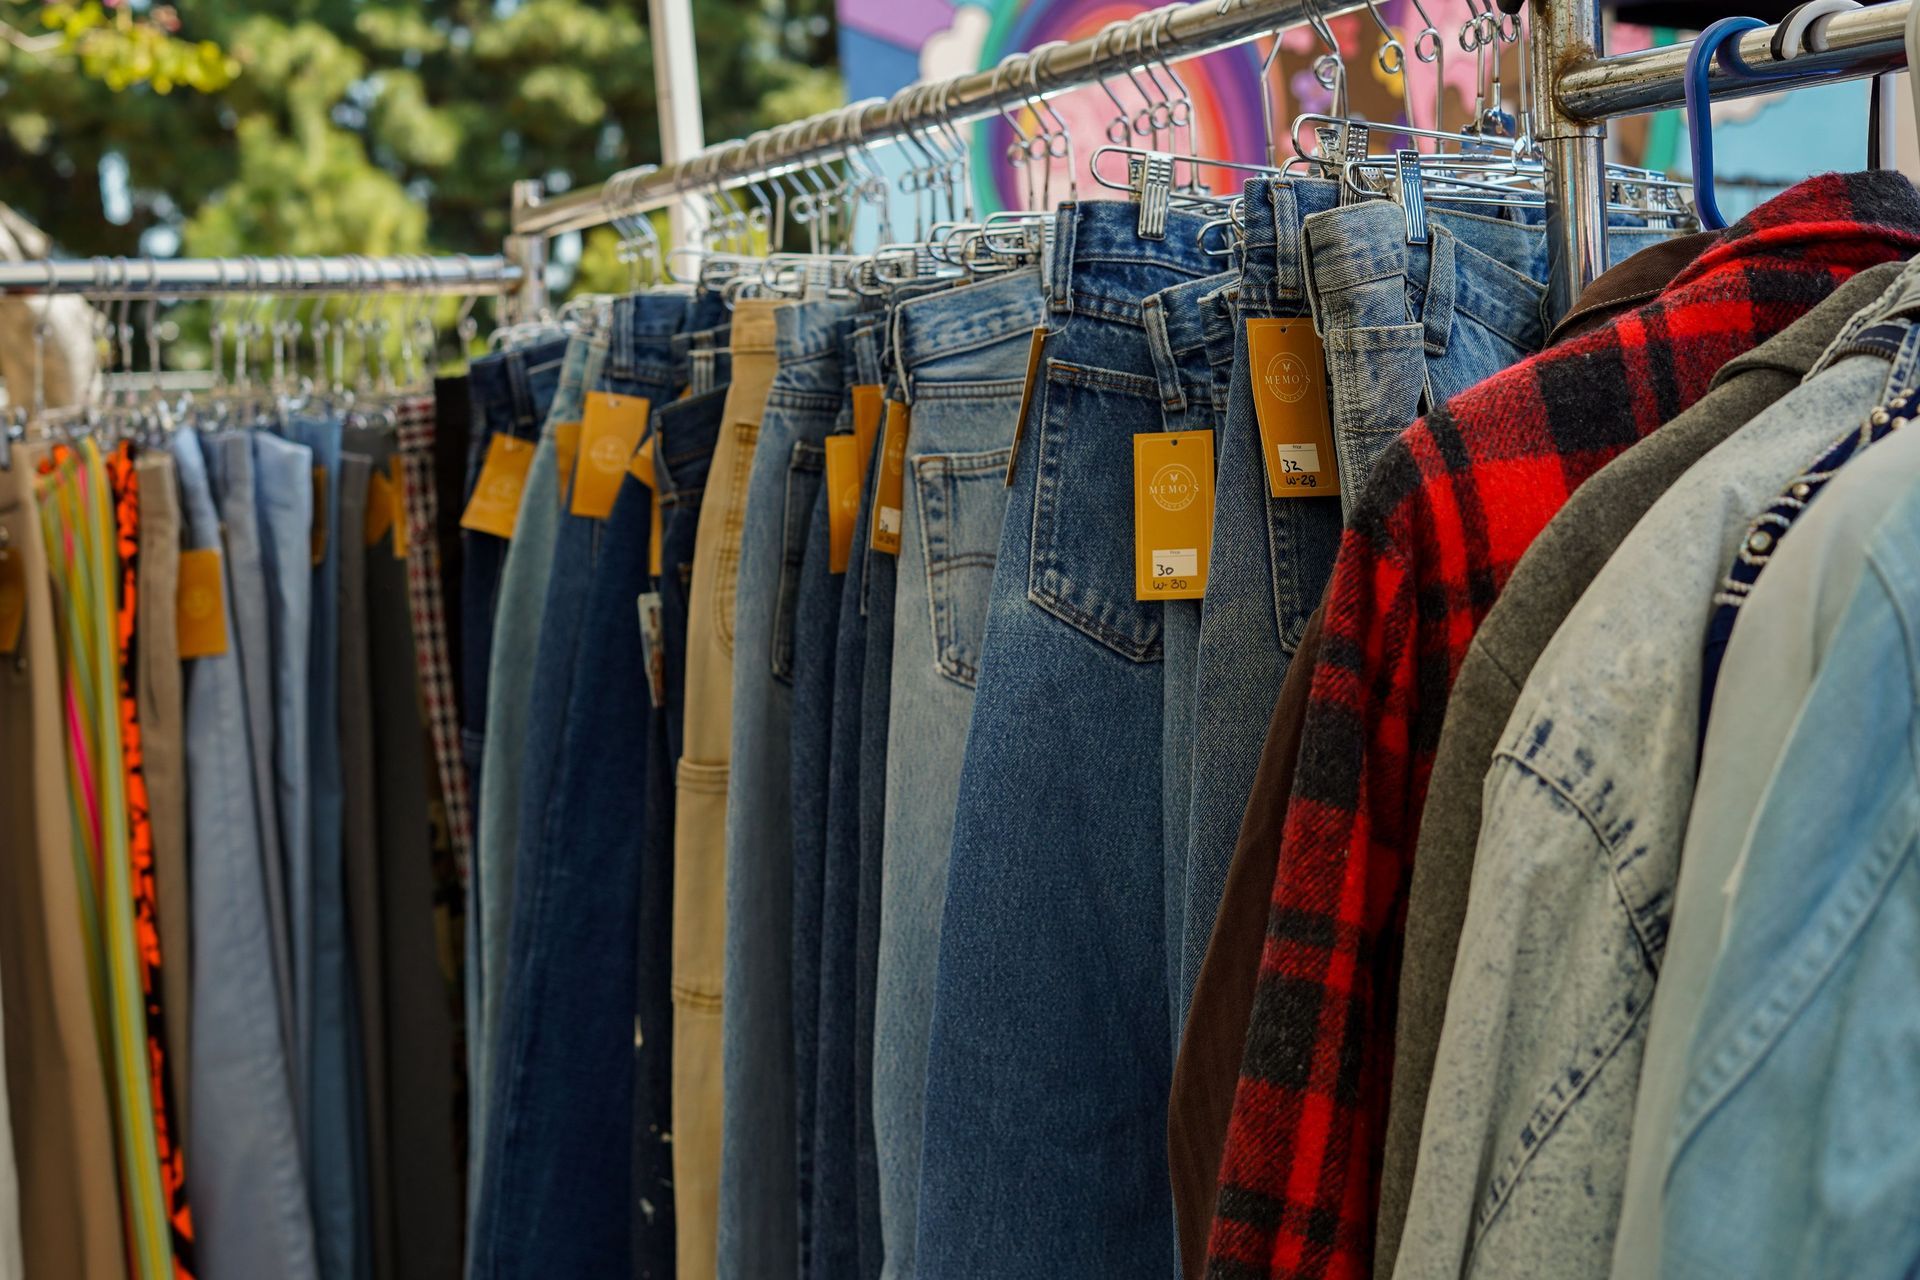
The impact on the local environment, as well as the health of workers and their families that live with them, is staggering. Yes, some of these materials were recycled into new clothing, toys, or other items to satiate consumer habits around the world. Much of this plastic, however, cannot be reprocessed and lives on, polluting the environment and communities surrounding these recycling shops.


Should China be doing more to protect its environment? Yes, of course. Should China be doing more to raise its people out of the cycle of poverty? Yes. However, we as a nation need to also examine the role we have in exporting waste around the world.


As an ever changing, global nation, each of us has a role to play in keeping all of the world’s environments healthy. Our role in exporting unsorted, dirty materials to China and other nations has now come back to haunt us. The fact that we ignored the realities of how our materials were being processed by adults and children in environmentally devastating circumstances is what should truly be haunting us.


The global flow of recycled scrap plastic, which ends up in mountains of burning piles and contaminated waterways, is an image we don’t want to face. 


The more than 8 million tons of plastic that ends up in our oceans every year is another image that troubles some, but hasn’t made a dent in our global production and use of plastics.


We are all responsible for a world which consumes more than one million bags every minute, and the 101 billion plastic beverage bottles sold in just one year in the U.S.


We are all responsible for embracing single-stream recycling without a vetted plan to ensure clean loads of recyclable materials that can be used in the manufacture of new products. We accept government agencies trying to save money by eliminating recycling positions, and thus failing to provide the consumer education needed to clean up the materials destined for processing.


Plastic is a valuable resource, one that needs to be used responsibly and with greater consciousness.


By Athena Lee Bradley

Share Post

By Antoinette Smith | Resource Recycling March 6, 2026
Fourth-quarter MRF commodity values in the Northeast reached five-year lows, as they continued to drop but at a decelerating pace, according to Northeast Recycling Council survey data released this week. The average value for all commodities fell to $68.41/ton without residuals, lower by 8.96% on the quarter. This level marks the lowest point since Q4 2020, when the grade hit $60.46. The report includes responses from 18 MRFs representing 12 states: Connecticut, Delaware, Maine, Maryland, Massachusetts, New Hampshire, New Jersey, New York, Pennsylvania, Rhode Island, Vermont and Virginia. With residuals, average values were at $52.49/ton with residuals, lower by 12.75% – the lowest point since Q3 2020, when the grade reached $40.19. The report also detailed the change in Q4 average values, with For PET, PP and mixed plastics (#3-7), as well as steel cans, the rate of decrease slowed in the quarter, while OCC, aluminum cans and mixed paper continued falling at the same pace as the previous quarter. Average pricing for both natural and color HDPE bales, brown glass containers and all other paper rose in Q4. However, clear glass, green glass and 3-mix glass containers, along with bulky rigids, fell during the period, after rising in Q3. The report points out that recovered glass often is marketed but at a negative value, meaning recipients are paid to take it away. Single stream decreased by 7.87% without residuals and by 9.82% with residuals, while dual stream/source separated materials fell by 10.57% without residuals, and by 18.98% with residuals. Although dual-stream MRFs did not decelerate as much as their single-stream counterparts, they did see a higher average commodity price compared to single stream for both with and without residuals. Residual material cannot be sold and is landfilled. The report also showed the 2024 share of each material at 18 MRFs, with OCC and mixed paper representing nearly one half of incoming volumes. Of the included states, five have deposit return systems for beverage containers, which results in fewer glass bottles, PET bottles and aluminum cans winding up in MRFs there. In addition, MRFs in those states typically generate less revenue from those recyclables, the report said. The report also showed the 2024 share of each material at 18 MRFs, with OCC and mixed paper representing nearly one half of incoming volumes. Of the included states, five have deposit return systems for beverage containers, which results in fewer glass bottles, PET bottles and aluminum cans winding up in MRFs there. In addition, MRFs in those states typically generate less revenue from those recyclables, the report said. Of the three approaches reflected in the report – single stream, dual stream and source separation – single stream is the most common. Read the article on Resource Recycling's website.
March 6, 2026
Northeast recycled commodity values hit 5-year lows Fourth-quarter MRF commodity values in the Northeast reached five-year lows, as they continued to drop but at a decelerating pace, according to Northeast Recycling Council survey data released this week. The average value for all commodities fell to $68.41/ton without residuals, lower by 8.96% on the quarter. This level marks the lowest point since Q4 2020, when the grade hit $60.46. The report includes responses from 18 MRFs representing 12 states: Connecticut, Delaware, Maine, Maryland, Massachusetts, New Hampshire, New Jersey, New York, Pennsylvania, Rhode Island, Vermont and Virginia. With residuals, average values were at $52.49/ton with residuals, lower by 12.75% – the lowest point since Q3 2020, when the grade reached $40.19. The report also detailed the change in Q4 average values, with For PET, PP and mixed plastics (#3-7), as well as steel cans, the rate of decrease slowed in the quarter, while OCC, aluminum cans and mixed paper continued falling at the same pace as the previous quarter. Average pricing for both natural and color HDPE bales, brown glass containers and all other paper rose in Q4. However, clear glass, green glass and 3-mix glass containers, along with bulky rigids, fell during the period, after rising in Q3. The report points out that recovered glass often is marketed but at a negative value, meaning recipients are paid to take it away. Single stream decreased by 7.87% without residuals and by 9.82% with residuals, while dual stream/source separated materials fell by 10.57% without residuals, and by 18.98% with residuals. Although dual-stream MRFs did not decelerate as much as their single-stream counterparts, they did see a higher average commodity price compared to single stream for both with and without residuals. Residual material cannot be sold and is landfilled. The report also showed the 2024 share of each material at 18 MRFs, with OCC and mixed paper representing nearly one half of incoming volumes. Of the included states, five have deposit return systems for beverage containers, which results in fewer glass bottles, PET bottles and aluminum cans winding up in MRFs there. In addition, MRFs in those states typically generate less revenue from those recyclables, the report said. The report also showed the 2024 share of each material at 18 MRFs, with OCC and mixed paper representing nearly one half of incoming volumes. Of the included states, five have deposit return systems for beverage containers, which results in fewer glass bottles, PET bottles and aluminum cans winding up in MRFs there. In addition, MRFs in those states typically generate less revenue from those recyclables, the report said. Of the three approaches reflected in the report – single stream, dual stream and source separation – single stream is the most common. Read report on CRA's website.
By Megan Fontes March 5, 2026
NERC’s Material Recovery Facilities (MRF) Commodity Values Survey Report for the period October - December 2025 showed a deceleration in the continued decline in the average commodity prices. The average value of all commodities decreased by 8.96% without residuals to $68.41 and by 12.75% with residuals to $52.49 as compared to last quarter. Single stream decreased by 7.87% without residuals and 9.82% with residuals, while dual stream / source separated decreased by 10.57% without residuals and 18.98% with residuals compared to last quarter. Dual stream MRFs did not decelerate as much as single stream MRFs but did see a higher average commodity price compared to single stream for both with and without residuals. The decrease seen in Steel cans, PET, Polypropylene, and Mixed plastics (#3-7) slowed as compared to last quarter, while the decrease remained consistent in OCC, Aluminum cans, Mixed paper, and Residue. Notably, average values for Natural HDPE, Colored HDPE, All other paper, and Brown glass containers reversed direction from last quarter (where they dropped in value) and saw an increase in value this quarter as compared to last quarter. Clear glass, Green glass, and 3-Mix glass containers, as well as Bulky rigids, reversed direction from last quarter (where they increased in value) and saw a decrease in value this quarter as compared to last quarter.